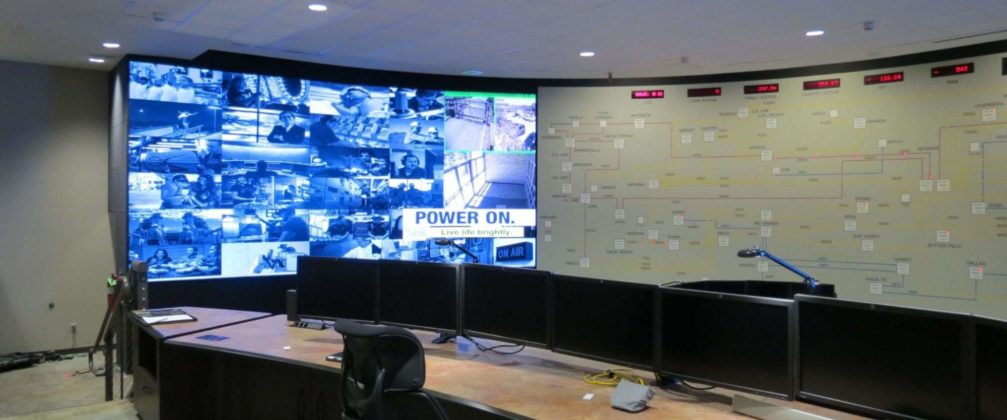
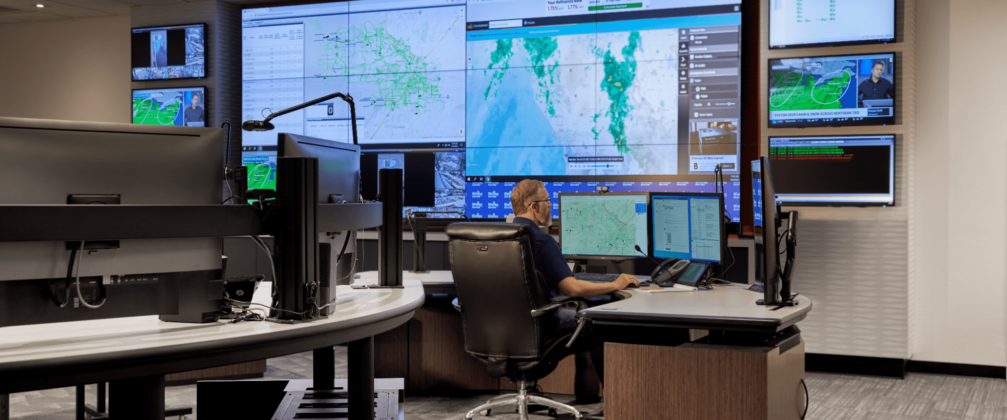
As the industry continues to grow and evolve, effectively visualizing utility data analytics is more important than ever. Immense quantities of big data pour into utility control rooms at rapid rates and must be interpreted in near-real time. While studies show that 80% of utility organizations feel big data provides new opportunities, only 20% have implemented analytics and visualization.
In this blog, we’ll explore the crucial role real-time data visualization plays in the daily operations of utility companies and how your organization can make the most of it.
What is Big Data?
Big data is at the heart of control room visualization for organizations in a wide variety of industries. This is especially true for utility companies, which are inundated with large quantities of data around the clock. But what is big data?
As the name suggests, big data refers to large, complicated data sets that exceed the abilities of traditional databases. Big data enters control rooms in large quantities at high speeds and must be interpreted and acted upon immediately.
Big data has three main characteristics: volume, velocity, and variety. Volume refers to the amount of information that comprises big data sets. Velocity indicates the extreme speed at which big data is created, curated, and processed. Variety is the different types of big data: structured, semi-structured, and unstructured.
Structured data is housed in traditional databases and can be analyzed in a fixed, static format. Semi-structured data can be structured or unstructured and typically doesn’t involve a table definition. Unstructured data comes from text sources and often requires special preparation before it can be processed by machines.
Why Visualizing Utility Data Analytics Matters
Utility companies play a vital role in the day-to-day operations of their local and regional communities. The industry is highly regulated, and even the smallest mistake can have catastrophic consequences. That’s why real-time data visualization is so important.
The utility industry is founded on a complex network of infrastructure, communications, information technology, and people. As big data enters utility control rooms, it must be displayed immediately to give operators the information they need to make data-driven decisions. Without the proper data visualization tools, utilities cannot satisfy the needs of their customers in an efficient and cost-effective manner.
How Do Operators Use Utility Data Analytics?
The ability to visualize utility data analytics (and synthesize them in real-time) helps operators maintain the highest levels of situational awareness. Utility control room visualization also allows your personnel to:
- Analyze and interpret large data sets at a glance
- Visualize asset inventory and monitor asset health
- Facilitate information sharing and collaboration
- Analyze relationships between data sets across traditional silos
- View information disaggregated by consumers
- Quickly identify trends and behaviors of interest
- Prioritize and streamline incoming information
Anticipating Customer Demand with Big Data Management
Utility operators with access to intuitive interfaces overlaid on geospatial data can more accurately predict demand. They can visualize historical trends, daily and annual peaks, heatmaps, data from geographic information systems (GIS), and much more. This gives them a holistic view of facilities, transfer systems, and customers that helps them anticipate (and satisfy) demand.
Visualizing utility data analytics also allows operators to request redundancy and backup support in the field, ensuring continuous operations. Communications with field operators can be displayed alongside data from outage or distribution management systems. Operators can also switch between geographic/topological and schematic network visualizations. This allows them to direct crews as they repair existing networks, install new systems, and take readings.
Why Utilities Need Real-Time Data Visualization Platforms
Utility companies use content management systems (like Mauell’s Xomnium) to visualize every action they take. These ecosystems should be fully-customizable to ensure the data operators require is visualized in a way that makes their jobs easier. Operators should also have the key metrics they need to communicate essential information across an organization.
Utility control room visualization platforms should integrate voice, chat, and video communications on both internal and external levels. Be sure to pair them with high-quality video walls that maximize the visual clarity of the content displayed. Video walls facilitate accurate monitoring and are a must-have for any organization that oversees utility generation, transmission, and distribution.
Key Requirements of Control Room Visualization Software
When it comes to visualizing utility data analytics with content management systems, you have plenty of options. Make sure the software platform you choose:
- Has a concise, aesthetically-pleasing dashboard that’s fully customizable
- Can be embedded into other applications for streamlined visual reporting
- Offers interactive reporting that helps you investigate inconsistencies and trends
- Helps you execute incoming big data management across your software networks
- Maximizes data mining to identify important patterns in data sets of any size
- Facilitates immediate visual communication across your organization
- Gives you end-to-end situational awareness by making data easily interpretable
- Provides in-platform incident panels for immediate troubleshooting
Additional Benefits of Visualizing Utility Data Analytics
The benefits we explored above are only the beginning of how big data visualization and analytics complement utilities. Let’s take a closer look at a few more benefits.
Enhanced Business Decision Making
A complete understanding of all the big data entering a control room helps stakeholders make the right decisions for their utility company. This enhanced operational efficiency gives organizations that visualize data effectively an advantage over the competition.
Compliance in a Highly-Regulated Industry
As one of the most highly-regulated industries in the world, the utility sector is under constant scrutiny from government agencies and end users. Trustworthy, clean data that’s digestible at a glance reduces the likelihood of compliance breaches and the associated financial penalties.
Lower Operating Costs & Improved ROI
Synthesized and logically-displayed utility data helps reduce operating costs, thereby improving ROI. And predicting (or at least anticipating) asset failure strengthens a utility company’s ability to shorten or eliminate downtime. Organizations can plan for repair or replacement expenses, helping them save large amounts of money in outage duration losses, regulatory inquiries, and overtime wages.
Strengthened Energy Conservation & Green Initiatives
Big data visualization helps utility companies work with governmental agencies to reduce energy consumption. Organizations can also identify energy inefficiencies and take advantage of valuable opportunities to improve their systems and reduce their carbon footprint.
Sources of Big Data for Utility Companies
Utility companies gather and visualize big data using a wide range of inputs and sources. These include (but are not limited to) the following:
- Cameras
- Cloud data sources
- Dashboards
- Distributed generation sources
- Distribution management systems (DMS)
- Fleet vehicles
- Geographic information systems
- Grid management systems
- Industrial Internet of Things (IIoT)
- Macroeconomic conditions
- Outage management systems (OMS)
- Security and surveillance systems
- Sensors and gauges
- Social media, emails, and text documents
- Supervisory control and data acquisition (SCADA) systems
- Wearables
- Weather information
- Workforce management systems
How Utilities Use the Industrial Internet of Things (IIoT)
There are many applications of the IIoT for utility companies, from smart grids and intelligent metering to remote robots and reporting sensors. Water management facilities use smart meters to evaluate pressure and flow, detect leaks instantly, and automate corrective actions. Electric utilities use smart metering to provide direct visibility into consumer energy consumption.
Smart meter reading also helps utilities gain a granular understanding of real-time analytics down to the substation level. They can track, forecast, and plan based on today’s energy consumption and production patterns. As a result, experts predict an expected $157 billion in smart meter cost savings by 2035.
Monitoring and operating their networks has become increasingly difficult for utilities as generation and loads continue to expand rapidly. However, smart devices and the IIoT offer large quantities of big data that allow utilities to collect, store, and manage the information they need.
